→ Fit for Purpose: Building Global Heat Data for Local Planning
Show notes
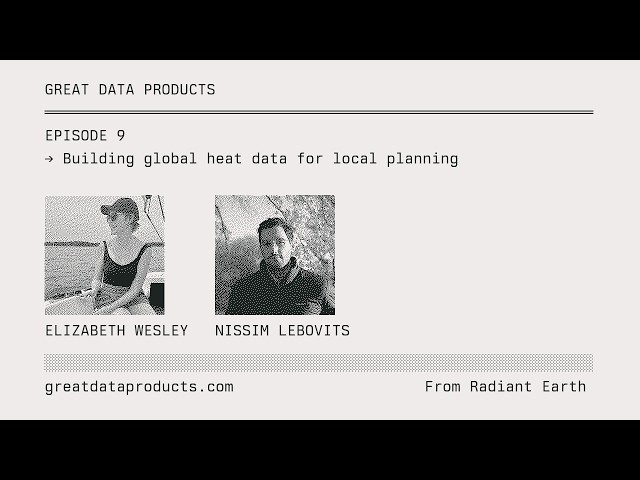
Nissim Lebovits, a technical fellow at Radiant Earth, guest hosts this episode with Elizabeth Wesley, a geospatial data scientist on the urban analytics team at World Resources Institute’s Ross Center for Sustainable Cities. Together they published a global composite of extreme land surface temperature on Source Cooperative, and the conversation walks through the decisions behind it: who the data is for, how much to process it, and what it should and should not be used for.
Elizabeth starts with why heat is the leading cause of climate-related mortality and why it hits cities hardest, then separates three ways of measuring it: land surface temperature from satellites, air temperature from weather stations and models, and thermal comfort indices like UTCI that estimate what a person actually feels. She describes WRI’s Cool Cities Lab, where the team models tree planting, cool roofs, and shade structures at one-meter resolution – work limited to a few dozen cities by the cost of compute, with hundreds more on the waiting list.
That constraint frames the product. Land surface temperature says nothing direct about people, but it is an infrastructure-centric lens on heat, and it is available everywhere. For a secondary city with no heat data at all, the counterfactual to LST is nothing. Nissim shares how Landsat data flipped assumptions about heat in Pergamino, Argentina, and the two discuss why they settled on a five-year 95th-percentile composite with a per-pixel observation count, why they left ASTER emissivity gaps unfilled rather than interpolate, and why documentation, a web map, and a QGIS plugin are as much a part of the product as the GeoTIFFs. Nissim closes with a live tour of the data.
Links and Resources
- World Resources Institute – home of Cool Cities Lab and the Ross Center for Sustainable Cities
- Source Cooperative – where the global extreme land surface temperature composite is published
- Landsat – the source of the thermal observations behind the composite
- Overture Maps – global building footprints used in the web map
- Hoffman, Shandas, and Pendleton, The Effects of Historical Housing Policies on Resident Exposure to Intra-Urban Heat (2020) – the redlining and land surface temperature study Elizabeth cites
Key takeaways
- Heat is three different measurements – Land surface temperature, air temperature, and thermal comfort indices measure different things at different scales. Matching the metric to the goal matters: citywide cool roofs target air temperature, while street trees and shade structures target what pedestrians feel.
- The counterfactual is nothing – Critics of land surface temperature compare it to better data most cities can’t afford. For those cities, a free, global, well-documented dataset is the difference between deciding with evidence and deciding without it.
- Fit for purpose beats perfect – A five-year 95th-percentile composite gives a stable, seamless picture of where surfaces run hottest. The relative differences within a city matter, not the absolute value of any pixel.
- Averages can mislead – Thermal comfort within a 100-meter cell is bimodal: shaded and unshaded. The mean describes a temperature nobody actually feels, which is why aggregating UTCI to decision scales is still an open problem.
- Docs and distribution are the product – A city planner in Cape Town is unlikely to browse a STAC catalog. Clear documentation, warnings in the interface, and a QGIS plugin meet users in the tools they already use.
Transcript
(this is an auto-generated transcript and may contain errors)
Nissim Lebovits: Okay, there we go. We’re live. Elizabeth, thank you for coming. And thanks to everybody who’s listening to this. My name is not Jed Sundwall, obviously. I’m not Jed. My name is Nissim Lebovits. I’m a technical fellow at Radiant Earth, and Jed is very generously letting me guest host a couple of episodes of Great Data Products, which I’m very excited about. Today I’m going to be talking to Elizabeth Wesley, who is a data scientist on the urban analytics team at World Resources Institute.
Elizabeth and I have spent the last couple of months publishing a global composite of extreme land surface temperature, which is now up on Source Cooperative. This has involved a lot of really interesting decisions about who we were publishing for and how we imagined people using these data. So we’re going to talking about that today. So to kick it off, Elizabeth, why don’t you tell us a bit about yourself?
Elizabeth Wesley: Yeah, thanks. Thanks for having me here. I’m excited to have this conversation. Like Nissim said, my name is Elizabeth Wesley. I’m a geospatial data scientist on the urban analytics team at World Resources Institute. We are housed in the Ross Center for Sustainable Cities and do a lot of work with urban heat.
I’m a geographer, so I’m very interested in the relationship between form and function. And so in this case, urban form things like cooling infrastructure and heat absorbing materials really affect the distribution of urban heat. And so, of course, none of this is distributed equitably, which is, you know, no surprise to anybody, but kind of a spoiler alert.
So my research focuses on mapping urban surfaces and their characteristics that influence the way heat propagates and manifests in cities. So things like tree cover, fractional vegetation, and albedo, because it’s actually these same qualities, excuse me, these same qualities of cities that make them hotter that actually present us with an opportunity to do something about it.
Nissim Lebovits: So I’m going to start off with a really, a really silly question. What is extreme heat and why is it such a big deal for cities?
Elizabeth Wesley: Yeah, I think that’s a really good question and something that we’re kind of navigating as it becomes more and more of an issue. Like obviously it’s getting hotter. Heat is actually the biggest climate related or the most deaths, sorry, is the leading cause of climate related mortality. And that has really increased with climate change. Part of the issue with deaths and illness from extreme heat is that it kind of happens quietly. These are things where people might die of stroke or a heart attack and it doesn’t necessarily get labeled as death from heat. It’s only something that shows up after the fact as like a statistical excess in mortality. And this is something that’s really happening a lot in cities for a couple reasons. Cities are where the people are. We’re over 50% urban at this point. I think it’s supposed to be 75% urban by 2050. Populations in cities are getting older, so there’s more vulnerability, and also income inequality is rising everywhere. And so that really affects the way people are kind of exposed to heat and the way that they are able to deal with it.
Also, and importantly, it’s the ways that cities are constructed really affects the way heat is kind of maintained in cities. The abundance of dark, impervious surfaces leads to heating and the lack of vegetation. And then also like the three-dimensional geometry of cities traps heat, especially at night.
And that is really important for people’s health during a heat wave to be able to recover from heat during the day. If it’s not getting cool at night, then you can’t really recover.
And then last and I think importantly to what we’re talking about today with land surface temperature is that these effects are highly variable in cities, kind of at the scale of city blocks. There’s a lot of inequality and that really manifests in heat disparities and it’s something that we need to be able to map.
Nissim Lebovits: So one of the things that’s really interesting when you dig into heat is like what heat actually is or how you measure it. I found this really fascinating digging into WRI’s docs when I first started working on urban heat. Because it’s like I it’s I think it’s pretty surprising that there are so many different ways to measure heat. So can you tell us a little bit about the different ways that you can measure heat and also why it matters which metric you choose?
Elizabeth Wesley: Yeah, definitely. I think this is a really good question and something that we focused a lot, like you said, our team, because we think of heat as just one thing, like, it’s hot. But it isn’t really, and it’s certainly not measured that way. And even thinking about what we mean when we say it’s hot, are we saying I feel hot because I’m standing in the sun?
Are we saying it’s a hot day because the air temperature is 100 degrees Fahrenheit? Are we saying the ground is hot because I’m standing on dark pavement? And those are three different things, and they all matter and they’re all measured differently. So what we’re talking about today, land surface temperature, is really it’s measured from satellites.
Which means we have data for it globally and frequently and we have it over a long period of time. But what it’s really doing is measuring like the skin, it’s called the skin temperature of the earth. And so that’s just like any surface that the satellite can see at around 10 in the morning, how much thermal energy is, you know. Radiating off of those surfaces. And so that’s what land surface temperature is. Then we also have air temperature, which is some and something I should say about land surface temperatures, it’s not something we experience really directly. Again, unless we’re talking about like the can you fry an egg on the sidewalks sort of heat. It doesn’t really affect us directly. It doesn’t really tell us anything about the way people experience heat.
Or are at risk from heat. Air temperature does that. So generally, when we’re talking about air temperature, that’s like the two-meter air temperature, and it’s generally measured with like weather stations. It’s what you generally see on the news. Because weather stations are sparse.
So we just have like point measurements. There’s a thermometer here, there’s a thermometer here. That doesn’t really tell us a lot about the spatial variation of air temperature. So we have a lot of modeled data or interpolated data. But because it’s in the air, it mixes.
So there isn’t a ton, there’s not the same level of spatial variation as there is with land surface temperatures. So when you look at maps of modeled air temperature in the city, you see a couple degrees generally of variation between different parts of the city. So it makes it harder to understand where there are disparities in heating and differences in exposure.
Then we also have a suite of what are called like thermal comfort indices. And these are based on mean radiant temperature, which has a lot to do, you know, it’s like, are we exposed to direct solar radiation? Are we exposed to radiation that’s bouncing off the sites of buildings and things like that? And so thermal comfort indices, our team is estimating the universal thermal climate index.
So they combine direct radiation, air temperature, humidity, wind speed, things like that. And they really get at what does a person feel like? What do they experience in a place at a certain time? And so there you can actually measure the difference between I’m standing on the sunny side of the street versus I’m standing under the shade of a tree.
How hot do I feel in the sun? And how much cooler do I feel under the shade of the tree, which can be something like 10, 12 degrees Celsius? And so we have these three different, and there are other measures, but these are these are the main ones that we think about. And so they measure different things at different scales. They all matter for the way we’re understanding heat in cities.
Nissim Lebovits: That was an excellent explanation of some very complicated different topics. And it also reminds me that we should we should shout out Landsat, which we’re both big fans of. Shout out to Landsat, which is where we’re getting land surface temperature data. I mentioned this the last time we talked, but I’m very excited for Max Lenormand and Jed. I hope this isn’t a spoiler, but they’re gonna do a series of episodes on great data products, and they’ll be talking about the Landsat program, which I’m very excited about. So we love Landsat.
Elizabeth Wesley: Amazing. Yeah, it’s yeah, that’s not too weird to say. I think I have a crush on Landsat. It’s amazing. It’s been, you know, imaging the surface of the earth since the early 70s and carrying thermal bands since the 80s. So much of what we know about global environmental change is because of Landsat.
Nissim Lebovits: I think Landsat is probably like the OG great data product. And it really has also driven a lot of the tech that we work with in the cloud native community. I mean, a lot of things like STAC, you know, STAC catalogs developed to hold that data. So I think that’s really a great example of a data product that sort of spurs so much more than just like the immediate work around the data itself. It’s pretty, pretty amazing. Okay, so we talked about different ways of measuring heat.
A lot of this is coming out of the work that you guys are doing at the Cool Cities Lab, which also shout out Cool Cities Lab is very cool. Can you talk a little bit about no pun intended, it’s very cool, yeah. Yes, yeah. But so tell us a little bit about that work and the different approaches that you guys take to measuring heat because there are there are a few different ways that you approach it and then some of the other data sets that you kind of bring to bear on the issue. So could you talk a little bit about that and talk
Elizabeth Wesley: We’ll take the fun. We can have the fun.
Nissim Lebovits: I’m particularly interested to know not just what you’re publishing, but where you’re publishing and what the limitations are of that too.
Elizabeth Wesley: Yeah, yeah, totally. So Cool Cities Lab is a data platform and decision support tool that our team at WRI released, I guess, last March. We went public with it. And so it’s a place where really trying to connect users in cities, local officials, city governments with the data that they need to like drive forth policy and take action on urban heat. And so it’s a place where you can explore heat data.
You can use it to prioritize areas in cities for thinking about heat resilient infrastructure, examine risk, and also opportunity. And it’s really focused around implementing passive cooling infrastructure. And so one thing that I was able to do that was really interesting work was develop what I think of as very realistic scenarios of infrastructure implementation. So planting trees along streets to shade pedestrians, implementing cool roofs at scale, and then putting shade structures in public parks so that there’s kind of a maximum of 50 meters that you have to walk to be able to get to shade.
And then actually evaluating their impacts on thermal comfort so that we have real metrics that cities can use and maps that cities can make and that be able to use those in their supporting documentation to present to a council or something like that to get a policy approved. And so in Cool Cities Lab, we’re bringing together land surface temperature data, which I’m sure we will maybe be using this wonderful product instead, which will save us some time and heartache of processing. And then also UTCI, which I was talking about. So my colleague Ruth Engel actually put together really amazing methods for using only globally available open source data for estimating UTCI at a one-meter resolution in cities. So we really are combining like that human scale of heat with UTCI, and then the more neighborhood scale heating. Differentials with land surface temperature and now we’re also starting to incorporate air temperature modeling in there. Also we have some wonderful models that we’re using from Lucy Hutyra’s team at Boston University. So we’re trying to bring together all three of those data sets, ways of measuring heat in like a comprehensive framework that cities can use. And so just a plug, we are look actively looking for more funding to continue this work. To be able to scale it right now. I think we have maybe 25 cities in Cool Cities Lab, 28 or something like that, and about half of them we have the UTCI data for because it’s very computationally expensive for us to run at this point. We’re using an adaptation of the SOLWEIG model. We’re working on some different ways of being able to do that, but we’d really love to be able to scale it to more cities.
And then something that I’m really excited about doing with it is, like I said, building it into a more comprehensive information framework because we do we have the three measures of heat. We have metrics that are calculated for each of them, but they measure things at different scales and it’s not exactly clear, I think, to me, how we bring it all together into a real decision framework that ties to the scales at which decisions are made. So for instance, what does it mean to aggregate UTCI? What does thermal comfort mean in a neighborhood? You know, you can say, I feel hot on one side of the street and I feel cold on the other, not cold.
Less hot on the other side of the street. But what does that mean when you start talking about like the decision scale? And so, how can we bring all of these things together in an information framework? And so we’re doing maybe all of our processing and storing in S3. And i’m not sure how much I can really say about like the challenges of that, because I’m thankfully not the person who does a lot of our back-end architecture. And it’s actually kind of the only place that I’ve known where I personally have done work like at this scale. So I don’t really have anything to compare it to, but just in this experience of working with you and seeing what you’ve been able to do. Can quickly pulling together an application where it’s easy to visualize this global data set that you’ve put together. That’s not our process and that’s not how we’re accessing the data. And I can see that there’s like a, you know, a real reason you’re doing things the way that you’re doing.
Nissim Lebovits: Yeah, I mean I think that was part of the part of the goal that we had in putting together this data product was sort of a proof of concept here. We’ll we’ll talk about this more, but you know, I think part of the hope was to start a conversation about what it might look like to scale this globally, to show that it’s possible. Because it is it is really hard. I mean, it was not, you know, the our conversations about what went into the data were very they were very, very easy relative to like the hours of frustration I spent with Claude trying to get this pipeline running. That was a very different experience. I felt much happier worrying about like striping and Landsat and the trying to get this running was a lot. But so I wanted to talk a little bit more about the limitation question because you taught you mentioned that SOLWEIG modeling is really computationally expensive. I think it’s are you working with Xiaojiang Li?
Elizabeth Wesley: Yes. Yeah. I think our model interpretation actually is from him. Like he provided us with that. Yeah.
Nissim Lebovits: Okay.
So he’s super cool for the record. He so he’s actually he is a professor in the planning program at the University of Pennsylvania where I did my master’s. They hired him the they hired him the first semester after I left, which I was very sad about because I thought his work was so cool. And I was I think in his interview actually and was like really strongly pushing for that. Not that the planning department cared about my input that much, but I thought he was very cool. I’m very excited you guys are working with him. I think his work is awesome. But it’s also like it’s crazy stuff. I mean, it’s like GPU accelerated, you know, deep learning frameworks for like really high resolution modeling of heat based on, you know, the like 3D buildings and shadows and stuff. And it like it’s it’s hard. I mean, you need like cloud computing and stuff to run it. So the consequence of that is that you can only really do it for a handful of places. So like what are the what are some of the cities that you guys have done this for? And what are some of the cities that you have not done it for?
Elizabeth Wesley: Yeah, well, thankfully because WRI is a global organization and we have seven different country offices across the world and really deep engagements with a lot of cities. We have a pretty diverse group of cities that we’ve been able to do this in. So all of our initial testing was in Cape Town. I always think of the data as being in Cape Town because that’s where I did like all of my testing. But so we have Cape Town, we have a couple different cities in Mexico, you know, Hermosillo is one of them, we have some cities in Brazil where we do a lot of work, and India as well.
There are some other ones I should know. I don’t, but it’s, you know, I think about 12 of them that we have. But I think after, you know, we had like an initial webinar when we went public with the tool, when we released the tool. And I think we have upwards of 300, 400 cities that have requested to be added. To Cool Cities Lab. And you know, we’re really eager to be able to do that for them. And even I should say also, even in the cities where we have the UTCI modeling, except for two of them, it’s just an AOI, like an area of interest in the city that the city’s provided us with where we’ve run the data. It’s not even at the city scale. It’s just a small area of the city. So even for those cities, we would love to be able to expand it to additional areas. And we are working on, you know, there’s experimenting with implementations, different GPU implementations. So now I think we can actually run it like not even in a cloud environment, but on a personal computer. What really ends up taking the most time is computing what are called sky view factors.
Because that’s like over a 24-hour period, kind of every three-dimensional surface that we’re putting into the model, it’s calculating from the angle of the sun on that particular day how is radiation propagating through the city. And for obvious reasons, it’s not computationally cheap to do that. But we are hopeful that soon we should have a faster implementation.
Nissim Lebovits: So the bottom leg here then is really it’s like compute and human resources basically. Like it’s expensive to compute this and you it’s hard to scale expertise to three hundred cities when you’re a small team.
Elizabeth Wesley: Yeah, well, and I hadn’t really thought about it in those words, but yeah, like right now those that is our limiting factor is just the expense of the compute. If somebody gave us a billion dollars tomorrow, it wouldn’t cost a billion dollars, but you know, if we just if money was not an option, we could get started now on creating UTCI maps for, you know, it’s I should say it’s also for a specific time on a specific day that you calculate UTCI because again it’s very dependent on the sun’s the solar geometry. So we’re calculating it for the hottest day in the last five years because we’re very interested in these kinds of extreme conditions. But we would be able to do that for a thousand cities tomorrow if we had the compute to do it.
Nissim Lebovits: So I think this brings us kind of nicely to the core question of great data products, which is really like when is a product sufficient? You know, Jed has this great graph, the little my gosh, I don’t remember my basic parabola. It’s like a little parabola shape thingy. You know, and sort of you got either end of like not processed enough to be useful, too overprocessed to be broadly useful, and then there’s the sweet spot of like the right amount of processing to be both. Useful and flexible for a broad range of users. And I think we have thought about something similar here with the data that we’ve pro published, which is less about the level of processing and more about like the underlying sophistication of the data, where like there’s a point at which the amount of compute required and the complexity of the scientific process really limits how many people you can produce it for.
So, like, you know, like you were saying, it’d be really great to publish UTCI for the whole planet, but that would be monstrously expensive and would require just like a ton of resources. So we have opted to do something that’s like slightly heretical scientifically, maybe. But so we’ve we’ve published a five-year P95 composite of Landsat land surface temperature. So we’ll we’ll break that down in more detail.
But let’s just start off like why land surface temperature and why P ninety five and why a five year composite?
Elizabeth Wesley: Yeah. Well, I mean, land surface temperature gets a bad rap, I think, for good reasons. It’s overused in the wrong ways a lot. And so just to go ahead and say it right now, so I guess I’ll start with why not.
LST. And then we can say why LST. So it doesn’t tell us anything about people, their experience, their exposure, their risk. You know, land surface temperature doesn’t correlate nicely with air temperature, and it correlates even less nicely with exposure, and it correlates even less nicely with health outcomes. But so it’s not like a person-centric lens on heat. But it is an infrastructure-centric lens on heat. And what it does is it tells us about like the radiative state of surfaces on a given day, you know, or over time, if you’re looking at it that way. And so again, it’s those surfaces that really are a lot of the ways that we can deal with heat. Do something about heat in urban areas is by modifying surfaces. So it’s actually pointing us to the places, maybe not where people are the most exposed or at risk or even feel the hottest, but where surfaces in the city are contributing a lot or very little to the thermal environment. And so what it is really good for is like spatially comparing areas within a city to see which areas, and so we want to talk about areas, I think a little bit more than we want to talk about individual surfaces, because even though we have this data at 30-meter resolution, it’s actually measured at 100-meter resolution, it’s just packaged at 30-meter resolution for convenience to match the other bands.
So it’s measured at 100 meters. So it’s, you know, the area weighted average again of just like whatever surfaces are viewed by the satellite at that time and their thermal radiation at the time.
But what it is really good at is being able to compare spatially areas within a city to see how surfaces in these areas are contributing to the thermal environment. And then the other why LST, and I think this is the most important, is because it’s available.
And we are making it even more available in a processed form. But we have pretty much global coverage, although there’s there are some areas where it’s missing, and we can talk about that if you want to. But kind of the I think the way that we want to think about this, and we’ll talk about use cases also, but like the counterfactual isn’t A city choosing between using land surface temperature in their city planning analysis or thermal comfort.
Or some better, some good air temperature data set. The counterfactual is nothing, right? Like a city can use land surface temperature, or they can use nothing, because a lot of cities don’t have any access to data that tells them about heat in their cities. I mean, you can install weather stations and try and interpolate, you know, there are like crowdsourcing methods that you can use for the individual home weather stations. You can use model data, maybe, but those things are all expensive. And so it’s a function of what a city can afford to commission. This data is open and free for anyone to use. And so for a city that doesn’t have access to data, can’t afford good data.
They have to make a decision anyways. And so we are presenting them not just with land surface temperature data to help them make that decision, especially prioritizing areas, but we’re also providing them with a very comprehensive, comprehensive documentation that tells them the correct, tells them and shows them and enables them to use it correctly and derive the right conclusions from it.
Nissim Lebovits: I think that’s that’s really well put. And it’s worth being explicit about which cities we’re talking about. I mean, you know, you I think habitually you see a lot of these programs that produce really high resolution data for the same cities. And there’s this like weird there’s like definitely an equity lens to it. It’s you know, there’s a strong focus on global south cities like Mexico City or Delhi or Nairobi, but it’s usually the same, very large, high impact.
Global South cities like Mexico City, like Nairobi, which are like, first off, I love both those cities, great cities. But if we only ever produce really high resolution data for those cities, then all the kind of secondary and tertiary cities where a lot of people live, never get access to high resolution data. And there’s sort of this like you know, there’s like a consistent awareness that, okay, with each generation of new data product.
You know, we they the data product gets better, but it’s not like there’s a trickle down effect of like, well, now we’re gonna go back and recalculate the old data product for all the other cities that we left out last time. It’s just like, okay, we’re gonna make a better version of the data product for the same major cities. And a lot of the time this tends to correspond to the cities that are also like highly exposed to heat, because we’re talking about like largely global south cities. So yeah, there’s definitely like a real equity concern here in making sure that we’re providing something, kind of good enough data, fit for purpose, I think, for a lot of these cities that otherwise, like you very well said, would not have access to anything of any kind for this kind of data.
Elizabeth Wesley: Yeah, I it’s so important. I really strongly believe this. And I think the arguments that many people leverage around land surface temperature and its inadequacies for certain things, ignore that. And I just I think we can’t do that, especially when we’re thinking about what we want any of this data to be used for, which is you know, to be able to do something about heat, right? To take action, to motivate action. If even if we’re thinking about planting trees or something like that, it takes 20, 30 years to really be able to see the benefits that trees can provide to people in this context. So like, I mean, what are the, what’s the proverb? Like a tree, you know, we should have planted a tree a hundred years ago or something like that, right? Like we need to do it now. And we have this data now.
And you have direct experience with this, right? Like with this kind of small, medium-sized city being able to use data like this to help them understand heat.
Nissim Lebovits: Yes. Yeah, I had worked in Argentina on this during my Fulbright grant. And I was working with a city of about a 100,000 people that’s in Buenos Aires province, Pergamino, which is like very, to their credit, they’re like very their GIS department. One particular guy, Federico at their GIS department, is like very on his shit. I’m I’m a big fan. And he had actually done a great analysis of urban heat, but like primarily based on a tree canopy map that they had.
And his challenge was like getting the city to pay attention to this issue. And so while I was down in Argentina, I was able to help work with him to use LST data to you know, map relative heat exposure or heat hazard in the city at a coarse scale. We actually went out and like we walked to a lot of the places that we had identified with LST, or we drove to some of the farther ones and like we got a really good sense of where it was like scorching hot and where it was not, and it also poke some holes in people’s assumptions. Like one of the things that they, you know, they had this idea that like because of the urban heat island effect, the core of the city would be really hot and the periphery would be cooler. But the province of Buenos Aires has no native trees. It’s just like shrubs and grass. And so the only place you see trees are the downtown where they’ve like planted, you know, non-natives in parks and you also have like a lot of awnings and like multi-story businesses and stuff on the main commercial corridor that are actually putting shade on the street. Whereas the periphery is a lot of like single story, spread out houses with nothing but pavement and shrubs. And so it was like scorching hot in the periphery and actually much cooler in the downtown. Which was something that we learned from Landsat that kind of flipped their understanding of heat in the city. And then we were able to pull in CMIP6 heat projections.
And look at that. And suddenly the local government was like, actually, this is like a serious issue. We should pay attention to this, look at these trends. This is a big deal. We need to do something about this. I for me, that was a very concrete example of the value of Landsat and land surface temperature, even if it’s not like a perfect metric.
Elizabeth Wesley: Yeah, yeah, I love that. And I may be like skipping ahead, but I think that is like a really great use for land surface temperature data, as long as it’s being interpreted correctly and that’s being conveyed, is communication. It makes for really compelling maps, and I think if people are clear about what these maps are saying.
It can do exactly what you’re talking about, which is kind of bring attention, help people zoom in to certain areas where they can say, like, what is going on here? Prioritize different areas, and then kind of after that be able to either move on to a different kind of heat modeling or you know, do some kind of different analysis or really just start doing work on the ground or with people in that area. But it’s it’s a way of starting the conversation. It’s a way of asking the first questions.
Nissim Lebovits: Yeah, let’s let’s do it. Let’s put the cart before the horse and skip right ahead to uses and then we’ll come back to the data. So how were we imagining people using this data? Like what was our goal here? And I think I want you to talk a little bit about that communication and storytelling component in particular, because we I think we agreed when we put this together that was a really core driver.
Elizabeth Wesley: Yeah, well let me talk about, you know, I was I’ve been thinking a lot about how this data has data like this has been used successfully. And I think it’s really like the story that you gave is essentially this the same story, but it’s it’s really a lot about yeah, communication and being able to see that spatial variability of the built environment and how it is influencing the thermal environment. But in 2020, this great paper came out, Hoffman et al. That looked at the relationship between land surface temperature.
The variation of land surface temperature in historically red-lined neighborhoods across the United States in like a hundred different cities. And so that was like a government-sponsored disinvestment campaign that was very racially motivated in the 1930s. But they found something like 94%.
Of the neighborhoods that had been redlined and so disinvested in, which generally means a lot less trees, a lot more pavement, more industrial development, more parking lots.
Had elevated land surface temperatures compared to the neighborhoods that had not been redlined or had a higher score, indicating, you know, and these were like white wealthy neighborhoods where they recommended investment by developers. And so these land surface temperature was really able to map the residue of these racist housing policies. And so that study got picked up by the New York Times and they did some really beautiful data.
Journalism about it. And I think that really helped get a conversation started publicly, and at least across the United States, and I think in a lot of other places as well, about heat as like a social justice issue. And so I think it’s really found its way into the way people are communicating about heat kind of in their cities, in their communities, in their neighborhoods. And so I think that is just a high use of a good use, a good use of land surface temperature because it’s those stories that then really motivate investment. Kind of going back to the way heat is kind of a quiet killer, I mean, that is a political issue as much as it is an epidemiological issue because how do you fund like what you can’t see, what you can’t count?
And so being able to measure and map something is the beginning of allowing you to change it. That’s WRI has this kind of statement about their philosophy motto, about their philosophy that I love, which is count it, change it, scale it. And that’s exactly what this does. It gets you started on maybe not counting, but mapping where these things are potentially an issue.
And so I think in terms of use cases for cities and city officials, being able to tell that story about the way the morphology of the city, the form of the city is influencing heat. And then using that in combination with local knowledge and then other data sets, like for instance, building footprints and tree canopy. Maybe some population density or vulnerability indices that you can start prioritizing different areas, either for implementation of programs or policies, or for further modeling or investigation.
Nissim Lebovits: Yeah, that’s a good way of putting it. I think in the in the readme for the data documentation, we’ll I guess talk more about documentation in a bit, we kind of describe this as a decision support tool. And I think it’s important to like sort of triangulate between the communication component, the decision component, and the scientific component. Because we’re trying to be fairly clear here that this is not meant as like a perfect scientific measurement, right? Like if you want the raw Landsat data.
You should pull that yourself. And I think that’s part of our thesis here, that like this is not really intended for like scientific users who are trying to be very finicky and particular about, you know, the exact computation. This is this is supposed to be a tool that is helpful for, you know, people who don’t have the capacity to run this on their own and who maybe, you know, would really struggle to interpret the underlying data and some of the like the wonky parts of it. Like we ran into a lot of weird stuff in the data. There’s like striping that was that’s really tricky. There are gaps from ASTER coverage. There are weird artifacts. You were mentioning photovoltaic panels that kind of lead to like really extreme values and so a lot of what we did was trying to like take this underlying complex data set and translate it into something that would be compelling and clear and not like raise more questions than it answers.
Elizabeth Wesley: Yes, yeah. And I didn’t even talk about when you asked me to talk about like why we used the 95th percentile too. And it’s exactly those reasons. I mean, you’re right, like we had to make a lot of decisions about how to process this data in a way to make it useful. And so we chose the 95th percentile because it’s most likely to represent. Very hot conditions or at least like maximum solar radiation. So the maximum response that surfaces are giving when it’s sunny. Because those, you know, those are the times, the periods of time when people are likely to be most at risk too. And we did it over five years because we wanted a very stable composite. You know, of course you get pixels that are masked by clouds at different times of the year in different places. And so I think Landsat is what every eight days that we’re able to get, or is it every 16? I never can remember. But anyways, to get a sufficient number of observations so that we could have a pretty seamless global composite. And you’re right, this isn’t it’s not the absolute values of any given pixel that are really of use here.
It’s the relative difference between them, in particular, like within a certain place, within one city. We wanted to be able to give them something that wouldn’t invite a lot of question. Why is there this weird stripe there? What is that really bright thing? Why is there data missing here? Again, it’s it’s the place to start.
It’s not the place to end in terms of like this data exploration and analysis and trying to draw conclusions. Something I think a lot about, and I like the way you put that, like triangulating between like communication and science and decision. Data isn’t the same thing as information. And it’s information that we use.
To turn, you know, information becomes knowledge and information can become action or policy, but data doesn’t become policy, data doesn’t become knowledge. It’s a translation of data into something that people can use and understand. And so we what we try to do is rely on our own.
Expertise that’s been honed over time, and those of the kind of scientific and computing communities that we’re in to and did our due diligence to ensure that the information then that we are providing to cities in the information that we’re providing and in a way that we are really trying to make it easy to use and clear to use, then.
Is directly usable in like an information to knowledge or information to action and policy kind of pipeline.
Nissim Lebovits: Yeah, very well said. Yeah, we’ve another thing that we’ve talked about before is like how much data or even information like actually factors into political decisions? I think maybe we’re both like a little cynical about this in the sense that you know you can have there’s a little bit of like a fetish of the perfect data set, right? This idea that like if we have the perfect data, you know, policymakers will make amazing decisions. And I it reminds me of this example from Philadelphia. We have like FEMA flood maps, right? There’s this island in the Schuylkill River. Near a part of the city called Manayunk. And there’s this island that developers have been eyeing for years that is like totally in the floodplain. So we’ve got this data. And the developers like, in spite of the obvious fact that it’s an island in the middle of a river in the floodplain, convinced the city council person in charge of this island to rezone it for development. And then predictably it flooded and they had to send the fire department to rescue all these people. And then you know, everybody freaked out for two seconds and then like flash forward a couple of years and once again they’re like rezoning more of the island to build more stuff. And it’s like, you guys, you have all the data you could possibly want on this. This just happened. Why are you doing this? So yeah, I’m a little cynical about how much perfect data really ends up impacting policy versus like a compelling story and good communication.
Elizabeth Wesley: Yeah.
I totally agree with you. And I think the other side to that too is not just like how data is used to like even if we had perfect data, what does that even mean, right? But if we had perfect data.
It still is not going to be necessarily used in this way that promotes good decisions. But also thinking about like what perfect data is, I love the way you said that, that it’s fetishized because we are. We’re constantly pushing for better, better, higher resolution data. But it just makes me think, my gosh, it’s not Alice in Wonderland, but it’s it’s one of his other stories. There’s like A map maker, a cartographer for a country, like talking to another character. And he says that they’re they’re really interested in producing the perfect map. And they worked and worked to create the perfect map and they finally did it. And it’s a one-to-one map of the entire country. And he said, But the farmers are really angry because it covers the crops, you know, and so you can imagine like a if perfect data is like a one-to-one representation, we have just recreated the earth or a city or like the problems. It’s not information. The information comes in a certain way with.
The non-perfection of the data, because it is a model. We’re abstracting and we’re simplifying. And that’s actually a really important part of this process because we just can’t, that much data doesn’t necessarily make sense. And that kind of goes back to the, you know, this issue with UTCI. How do we aggregate it? What does it mean to even have a metric of UTCI at a neighborhood scale, let alone a city scale?
You know, the UTCI is great data. It’s really great data. And we’re excited to be producing it. The cities are excited to have it. But we’re really still trying to figure out what do we do with it now, you know.
Nissim Lebovits: I’m I’m really interested to hear more about that and to understand like what particular experiences have made you feel like it’s not enough to just keep pushing UTCI. Like do you have any stories about things that have happened that have sort of shifted your perspective on this?
Elizabeth Wesley: No, I don’t. I wish that I did. I don’t. A lot of it’s happened in my head, I think. And then also, you know, like in my R console but and just thinking about. So I guess I can say, yeah. So in Cool Cities Lab we have some heat indices that we’ve put together, you know, pretty standard like vulnerability and hazard risk. Combining into indices and so it’s easy to create an index like that using land surface temperature. You know, we have it aggregated to a hundred meters to match the WorldPop grid so that we can use their wonderful population data sets and it so you can just take, you know, a mean land surface temperature over a hundred meters, but it’s not so simple thinking about UTCI. How do we put UTCI into an index like that? Because it is an incredible measure of hazard in that way. It’s actually like these metrics of thermal comfort, UTCI in particular, were created to measure or estimate, I guess, the actual physiological experience of the human body. And so it’s directly related to the health impacts of heat, you know, above a certain threshold that starts to get very dangerous. And you can measure that directly and much less ambiguously than you can with air temperatures, something like that. But how do you aggregate UTCI to 100 meters? And so of course they started by looking at the mean, but the distribution pretty much anywhere is distinctly bimodal because you have shaded pixels and you have unshaded pixels and they have very different UTCI measures. And so how do you how do you aggregate that into a single value, this bimodal distribution? If you take the mean of that, what I mean, it doesn’t really mean anything, right? Because then you’re saying, 30 degrees Celsius is the mean UTCI, that’s how hot you feel, except nobody feels that way in that hundred meter pixel because they actually feel cool in the shade or hot in the sun. Nobody feels 30 degrees. Everybody feels one of these other two, but that’s the mean. So that’s not the right information.
Nissim Lebovits: That’s actually really fascinating. I love that example. That’s I had never thought about something like that, but that’s a super interesting problem to run into. And yeah, it’s it’s go ahead.
Elizabeth Wesley: Well sorry, go ahead. No, it was funny. I just had this aha moment not that long ago actually. I was like, you know, end of the summer at the pool, just kind of chilling out, reading something. And it said something I whatever book I was reading about like the average life expectancy during the Middle Ages. And I was just kind of daydreaming and I was like, gosh, they really how did they get anything done if everybody died when they were thirty? You know, nobody lived above thirty.
And then I was like, my God, wait a minute. It must be a bimodal distribution because infant mortality was so high and you were so likely to die as a child. And so I looked it up, and sure enough, if you lived past childhood, people were quite likely to live into their 60s or 70s. Life expectancy hasn’t really changed that much. I mean it’s it’s changed a good bit, but it hasn’t changed that much. It’s just that a lot of people died. In infancy. And so when the mean is reported, you think, everybody lived until they were 30, but that’s totally not true. Most people lived until they were five or sixty-five.
Nissim Lebovits: That is an excellent I don’t know if it’s trivia. I it’s I feel like it’s actually really practical. Trivia feels like it trivializes it a little bit. That’s really interesting. So I wanted to talk a little bit about the level of data processing then that we ended up settling on in terms of like, you know, we spent a lot of time in the data. And one of the issues that you run into in publishing any data set is deciding on like how much not exactly do we want to hold the user’s hand, but how you know how much work do we want to do for them to make this easy to use versus how much do we want to give them flexibility? So we ended up publishing basically a single there are two COGs in the in the data set. There are for each tile globally there’s a land surface temperature GeoTIFF and a QA count GeoTIFF that shows the number of observations per month.
Which is like a pretty simple data set. So how did we land on that as like the core product?
Elizabeth Wesley: Well, I’m gonna say a little bit, but I wanna turn it around to you too, because I think you’ve spent a lot of time thinking about this and you’ve really had your fingers in the data in a way that maybe I didn’t as much, but just having spent time with land surface temperature, I mean it’s kind of messy and kind of weird. And given the constraints about being able to interpret it or use it at all, I think we just wanted to give people something that was easy to understand and interpret kind of on first glance. And so that ended up being taking, making a lot of these kinds of decisions because I mean you can’t it’s pretty esoteric even for somebody who spends time with remote sensing data products, right? I mean, we’re thinking about like atmospheric corrections, scene by scene, and like radiometry and the emissivity of surfaces and clouds and all of these other kinds of things. And that’s a pretty high barrier for somebody working in like a city planning GIS capacity to have to think about. And so we wanted to make sure like those considerations didn’t get ignored.
But that also it wasn’t a blocker to someone being able to use this data. But I would really like to hear your answer to that question too.
Nissim Lebovits: No, I think that’s spot on. I mean, I think we were, you know, we’ll talk about this in a sec. We were really thinking about who our end users were and how they’re going to probably use these data. And about trying to, you know, like help them avoid all of the headache of like Dask parallel processing and like rediscovering from scratch the issues that we ran into. I like at some point in the last year, I picked up the phrase compute is expensive, storage is cheap.
And I think that applies to people as much as it does to actual computation. Like it is really difficult to think hard about something and figure out the answers. But once you’ve done that, if you can encode that in a re a reproducible way, that you’ve saved everybody a lot of hassle. And so I think that was sort of our core goal here was to like, you know, muck around in the trenches and figure out ASTER GED gaps in the data. Like there are all these gaps in the data where the original ASTER satellite.
Was never able to collect observations. And so there’s striping, like in particular in parts of over the north of Russia or in the Amazon or off of Durban in South Africa, as we found out. And there’s just nothing you can do about that. And so we’re very explicit in the docs that, like, yeah, there’s nothing we can do here. And we talked about doing something like interpolation to try to gap fill. And ultimately, our decision was like, we want this to be a fairly transparent data set. We want to give people something that’s simple.
Where we’re not overpromising and where this is like good enough for a lot of people. Like, is this going to solve everybody’s heat data availability problem for all time and forever? Hell no. But it gets us a lot closer, right? It’s like better than just having heat data for 30 cities around the world. And it’s not 100% coverage, but it’s pretty good. So I think that was, you know, a big part of our consideration here. And then there was the question of like, how do we see people using the data?
Which I you know, I want to come back to. And I guess I’ll just turn it over to you. Like how do we see people using these data?
Elizabeth Wesley: Yeah, I mean, I think just like more of what we’ve been talking about, my hope is and I not hope unfounded because we’re putting and will continue to put a lot of effort into the documentation. You’ve built a web app, and I was very impressed that even the basic information when you hover over the land surface temperature layer, it says in bold, underlined like this is not a measure of heat risk to people, you know. So we’re providing documentation to make it very clear how the data should be used and interpreted, but I’m hoping it is going to be used to tell stories, to motivate action, and both from, you know, kind of interest of people who live in a city and understanding of what’s going on there, but then in particular as evidence.
To get policies passed to start implementing these kind of passive infrastructure solutions. And then also, you know, just having it be top of mind as an issue for cities to then also be doing things like building cooling centers or making sure basic things, people have enough water.
That there’s shade, misting stations, and things like that. Because I that’s part of it too, is like we already know what it is. We know that it’s hot and like we know a lot of stuff that we can do about it. But because of the way things work, and especially in cities and city planning, and you have to, there’s governance and you have to have policies, and those things require metrics and evidence, like.
This can provide the evidence that is good enough to pass a policy that then you can start doing what we already know should be done and is going to be beneficial. And then I hope that it can really be used, I think, in that same context to help prioritize areas like we’ve been talking about, you know. I mean you can and so in the web application we put in the building footprints from Overture Maps, which is an incredible global data set of building footprints. We have tree canopy cover from WRI and Meta. Made these incredible maps of global tree canopy at one meter resolution. We discussed putting WorldPop in there too, so that we can have some measures of population density. And then we have land surface temperature. And so I think between those things you can really say, okay, well, where do people live in those places? Which of those places are really hot? And then in those places that are really hot, which areas are lacking trees or which have a lot of buildings, maybe those can get some cool roofs. I mean it really will help say, you know, if there’s some fund to start putting cool roofs on buildings.
And they need to target three neighborhoods out of 40 or something like that for a pilot program. I mean, use this data and this setup to help you make that decision instead of just like who is lobbying for that in the city council, right? Like which developers are interested or not interested or where are the wealthy people and they are able to advocate for themselves or something like that. I mean these decisions are going to get made anyways. And so this data and this data setup can really, I hope, help inform that kind of prioritization.
Nissim Lebovits: Should we talk docs then? I think that’s I think that’s a good segue to docs. And then maybe I’ll share my screen and we can actually look at the data. Because we, you know, we were pretty deliberate in building this data set and thinking about the fact that like docs are part of the data product. Like they’re not secondary. And we took inspiration from things like FAIR and the candid core framework.
And also the work that I’ve been doing on the Portalon project with like Chris Holmes and Javier de la Torre and the folks at Carto, which I’m very excited about, which I’ll talk about another time. But the but the core idea here is like the documentation and the metadata are really, really important. And it’s not enough to just throw up a couple of things. We have to like put something together that’s really thoughtful, which speaking of candid core, I will candidly admit is not like fully fleshed out. We are still figuring this out, which in small part is due to the fact that I took a while getting these data processed, but we do have stuff.
So I’ll I’ll share screen and we can I can figure out how to do this.
Cool, look at that. There’s my screen. So the data are up on Source Cooperative, which I’m very excited about. Shout out to Source Cooperative. Put your data on Source Cooperative if you’re listening to this. And we’ve got a README here that like explains what we were doing here and what the philosophy behind this project was, a lot of the stuff that we’ve talked about here, and that like this is very much meant to be kind of a first pass.
Like, you know, you mentioned this is about communication. And I think that’s true on multiple levels. There’s the communication in the sense of we want people to be able to use these data to communicate to government officials and decision makers, but we also want this data to start a conversation about providing heat data for, you know, a broader audience and like the best, most effective ways to do that. And so hopefully showing that it’s possible to build sort of a V0.1.
Of a global land surface temperature data set opens the door to conversations about how to do this better. We also, you know, we’re very deliberate about like declaring some of the things that we did that are maybe not so kosher, like how we handled normalizing bias in scene correction and stuff. We talk about storage access, some of the known issues. This map renders kind of funny, but these this is the striping that you’ll see in the map in a sec. These are these known gaps in ASTER’s coverage. We I actually calculated what percent of urban areas these crossover, which I thought was kind of cool.
Elizabeth Wesley: And we should say for anybody who doesn’t know that land surface temperature is calculated from like the radiometric brightness temperature, I think, from Landsat. And so what that means is it needs to be scaled for the emissivity of surfaces. And so ASTER is the data that NASA uses to scale for emissivity, but the ASTER data is incomplete.
Nissim Lebovits: I’m I’m glad I have like a proper data scientist to talk to about this to explain emissivity to me. And then we talked about intended use and ancillary data, like you mentioned, the built-up volume and building footprints and that kind of thing, and the tree canopy gap. And we are working on an example notebook, a Jupyter notebook that sort of shows basically how to use this, which we hope will be important context for people who want to apply it.
So we’re excited about that. And all this is also backed up in a GitHub repo. It’s the same thing. This is a Portalon catalog, which I’m very excited about, which probably doesn’t mean anything to you, Elizabeth, but I’m very excited. It’s the other project that I’m working on where we’re trying to like publish geospatial data in better documented ways with information for agents and for people and like scalable and object storage. So that’s that’s for another podcast. But let’s look at the map.
I’m I’m excited to look at the map. So this is the map that we’ve got so far. Clearly I need to figure out my overviews situation here. I feel like a little bit like I’m airing my dirty laundry, but it does load.
Yes. Yeah. So I’m really excited about this map. It looks cool. Let’s let’s dig into it. Is there anywhere we should go? I hope it works wherever we go.
Elizabeth Wesley: Yeah, I don’t know. Where are you? Let’s go where you are.
Nissim Lebovits: The Hague is so boring. It’s not gonna be very interesting. Although I guess you’ll probably see the force. Let’s let’s go to let’s go to Pergamino. Let’s check out Pergamino, which I know. Shout out to my friends in Argentina. So this is where I was working in Argentina. And I think it like opens up a lot of really interesting conversations. So I’ll turn on the satellite imagery real quick and turn off land surface temperature. So you can see the city here. There’s a river that cuts through it. It’s about 100,000 people. Buenos Aires is kind of off.
In this direction or maybe this direction, I don’t remember. It’s it’s east of here. But you can see that it’s like really heavily agricultural. And one of the things that gets really wonky here is like if you just look at land surface temperature, it looks like the city is really cool. Which is like a real challenge because it’s not cool. It’s just everything else is agricultural land with no trees or buildings. So the land gets really, really hot. So when I was down there, one of the things that I had to do was stratify. Analysis of land surface temperature by land cover class and like zoning to be like we’re only gonna look at populated urban areas, otherwise it’s gonna look like it’s really cool there relative to everything else.
Elizabeth Wesley: And I think this is a good point to mention. Like one thing that tends to be done with land surface temperature, and we definitely are not advocating for is like a calculation of like urban heat island effect effects, you know, indices. And so usually how that’s done is like differencing urban. Land surface temperature with rural land surface temperature. And this gets it exactly why that’s not really an appropriate thing to do, you know, because it’s then so what we’re trying to say is like how much hotter is any given area in the city than rural areas. But it’s not always true, like you’re saying, that the difference is that rural areas are cooler.
And the city is hotter. And that’s very dependent on a bunch of different factors, including like moisture content. And it’s prone to change for reasons that have nothing to do with like heat and land cover change.
Nissim Lebovits: That’s an excellent point. And like, yeah, that’s excellent point. And I think it’s really cool when you actually zoom in on the data too, because it becomes even clearer how nuanced this is. One thing, so one thing that’s really fascinating in Argentina is I this is like a personal pet peeve, but I don’t like Latin American park planning by and large, because they tend to have this is a gross generalization, but like in the parks that I’ve been in Latin America and several different countries, there’s a lot of paved surface and a lot of grass.
And a handful of trees. And so, like, if we zoom in here on like the hot areas, this is the downtown. Then you see like here and here are kind of hot. And if you turn off the heat, you realize these are actually parks. These are their parks because there are no trees or very few trees. And so it’s this weird, like, counterintuitive effect of like the parks are really hot. And then if you turn on the tree canopy height, which hopefully will load, this is so cool. I love that the Taylor Geospatial, I think was Isaac at Taylor Geospatial, made a cloud native copy of the tree canopy cover data. So this is like just COGs in a bucket, which I’m so excited about. It made it really easy. Like when you sent that link over, I was like, amazing. Okay, this is gonna take me half an hour. Then it took, it took Claude half an hour. So very exciting. But we can see all these trees and it’s really cool. And then you can sort of compare you know, land surface temperature to tree cover, and you can see that it’s like. Primarily in places that don’t have a lot of trees and then we can turn on the building footprints too and hopefully they load reasonably quickly. Yeah, there you go. So we’re we’re very excited about this. And I guess we’re still kind of figuring out exactly how to use the app, but really it’s like conversation starter.
Elizabeth Wesley: Yeah, I think conversation starter, maybe we can you know, enable like easy printouts or being able to like embed a certain kind of map view in a document or something like that and copy it to a PDF because they yeah, it’s it’s conversation starters, it’s a way to I mean this is exactly it, right? Like we’re able to zoom in on this area that’s hot and think what is going on here.
We figured out it’s a park. We figured out there’s not a lot of tree canopy. Now, if we’re someone, you know, a city official, a planner, like we can start figuring out what to do with it. Is it a park that a lot of people use? Do we want to provide more shade? Is that in the form of trees? Is it shade structures, you know, which can start providing benefits immediately? So then you can take this map with these layers and put it in a policy document. As evidence, maybe calculate some metrics.
Nissim Lebovits: Is this is this the right one? You guys have this great article on no, this is the wrong one. You guys have this great like list of interventions and I can’t remember where it is.
Elizabeth Wesley: Yeah, I think that I think you’re probably talking about a blog post that I wrote. What is it? I don’t know. Go it on the bottom, actually, if you go to me there. There should be a list of my publications at the bottom. There we go. Cities are heating up. Better infrastructure can cool them down. And then if you go all the way to the bottom, there’s like and this gives like all the different mechanisms of heating and cooling down.
Nissim Lebovits: Yes, yeah, this is the one. Yeah. Yes. So I need to actually link this in the website because I think this is great and it makes it so concrete. I mean, I don’t know how explicitly we’ve said this. You definitely said this during this conversation. We know what to do, right? It’s like it’s not a secret. We generally know what to do about urban heat.
Elizabeth Wesley: Right. Yeah, yeah, yeah.
Yeah, absolutely. And this is nice because it’s really, you know, you have to think about it too. It’s we know what to do. But again, saying we know what to do about urban heat, well, we also know that there are different ways to measure heat, different ways to experience heat. And so these things to do are also tied to different goals, you know. If you’re interested in lowering citywide air temperature, then that’s gonna be something like citywide implementation of cool roofs.
If you are interested in decreasing exposure for people, especially on very hot days, then that might be something like tree planting or like I said, a huge fan of just not artificial, you know, man-made. Shade structures, person-made shade structures. Because those provide benefits immediately. And they’re really lovely ways that it can be done too, or passing out water or something like that. Those are different heat goals and there are different mechanisms the way these things work. And so you have to target them pretty specifically, matching goals to measures and metrics.
Nissim Lebovits: Right. And then there’s always the risk of the measure becoming the objective in ways that kind of create perverse incentives and stuff, which is complicated.
Elizabeth Wesley: And I think a good point for this is that yeah, also like land surface temperature isn’t lowering land surface temperature isn’t the goal. On like it’s not anybody’s goal. We’re not promoting that, you know. It’s it’s a good way of zooming in and seeing what’s going on in a city, but it’s not what we want to use as a response variable by any means.
Nissim Lebovits: Right, totally. You mentioned PDF thing and the maps, and I think that raises an interesting point, which is about like how we distribute information, which is something I think a lot about as like somebody who I guess moonlights as like a software engineer. I don’t really know exactly what I do. I it seems to struggle to pick a lane, but that’s whatever. But so we were deliberate about putting this stuff up on Source Cooperative in cloud optimized formats with the STAC catalog and all that fun stuff. And we’re working, we’ve got the website and we’ve got a QGIS plugin that we’re working on. What about the experiences that you’ve had at Cool Cities Lab and on in your other WI work makes you think that it’s important to find new ways to reach new audiences? That it’s you know, that how we distribute data matters as much as what is in the data?
Elizabeth Wesley: That’s such a good question. I mean, at like the fundamental level, we don’t know what we don’t know. You know? If we don’t, one, like not me, not you, anybody, just like especially a city planner or something like that. Like if you if you don’t know it’s out there, how are you supposed to know that it’s out there?
I mean, just fundamentally and I mean all the time I’m surprised by finding out that there’s some data set, even something I’ve been desperately looking for, that’s been there the whole time and I just didn’t know about it. And somebody’s like, what about this one? Is that it? I’m like, my gosh, that is totally it. You know? And I think especially like because it’s it’s exciting to us, I think, as the people who are like in the weeds of like data and computation and information and mapping and trying to create these data products. Maybe that there are things that we know, but there are people all across the world doing all sorts of work that are would be interested in having this information, but that doesn’t mean that they’re like know what Source Cooperative is or a STAC catalog or something like that, that even if this data set or this podcast, for instance, you know, who’s going to listen to this? It’s probably not a city planner in Cape Town, you know. Like we need to make sure and be able to get outside of these kinds of bubbles of information and put it into a broader context. And I think, you know, of course, communication is a big part of that, but I think also accessible communication and through like accessible channels, you know.
Maybe we can see if we can do like an op-ed article for something, some media outlet that would be popularly read by city planners or something along those lines, you know. Yeah, I don’t know if that really answered your question, but there are like different channels through which things get communicated and understood and even if it feels like we’re communicating to like a broad set of people by making the documentation accessible, you know, usable or what we feel like is accessible, what does accessible really mean if somebody doesn’t know it’s there?
Nissim Lebovits: Yeah, I mean I think you’re getting at the idea of meeting people where they’re at, basically, which is the goal of something like a QGIS plugin. And this, you know, I don’t like QGIS personally. Let me back that up. I love that QGIS exists. I think it’s an amazing initiative. I would much rather work in the command line, but or you know, or in Python or something. But my experience in Argentina was like everybody that I knew who was a municipal government was working in QGIS. And I think that’s an amazing accomplishment.
And so rather than insist that everybody in municipal government has to like get on the Python bandwagon, you know, we should meet people where they’re at. And that’s a that’s a big deal. And so trying to find ways to do that is really important. Okay, so I think that’s a good segue to the last question, which is what comes next? What does success look like for this data product and for this project?
Elizabeth Wesley: Good question. Yeah, good question. I think success what I would think of as success is maybe something like being able to collect stories of people actually using this data. And hopefully. Being able to trace it through kind of information pipelines in cities and see it make its way into policy. You know, I mean like for instance, a New York City, their planning commission, you know, they have like a hundred million dollar program they started in 2017 called like Cool Neighborhoods or something like that. And it relies on like a heat vulnerability index.
To prioritize funding for different heat-related infrastructure. And in that heat index, they use land surface temperature. And so if we could trace something like that, you know, understand who’s using this data, get it first, get it out to people, understand that people know that it’s there, have some way of measuring that, that people know it’s there, and that they’re able to use it.
And then collect those stories and see how it goes. And then I think most successfully would be able to share those stories in a narrative way. Like, look, this kind of work is very possible. Change is very possible.
There are people doing it and like let’s spread those stories because it’s, you know, it’s the crazy world that we live in right now, and things are changing all the time. And there’s not exactly an abundance of good news out there, but there are a lot of people doing great work. And to be able to see this get into their hands and start affecting change and to be able to. Highlight what they’re doing and their stories, I think that would really be success measure, you know, good measure of success for me. And then for what comes next, you know, hopefully be able to you know, continue to build If there’s interest, you know, something that I think land surface temperature can potentially do that is maybe a little bit untested and not really available to us with the way that we’ve processed this data set is measuring change over time from implementation of infrastructure, you know, cool roofs in theory. With lower land surface temperatures because they’re absorbing less radiation from the sun. And so we would be able to enable people to like track programmatic change over time. If we were able to you know, create like a V1 or a V two where we, you know, it would take more intentional processing to be able to have a yearly composite, I think. But continuing to use this data set, maybe improve this data set, but then build it in to other informational frameworks like Cool Cities Lab, you know, and just to kind of talk about it again, like really build it into a comprehensive heat information framework so that cities can understand like what is city officials can understand what’s happening in their cities and kind of what to do about it as it relates to various goals across scales and related to like the scale of decision making.
Nissim Lebovits: Okay, great. Well I think that is an excellent note to end on. Thank you so much for talking with me and for working with me on this. It’s been a lot of fun and I’m looking forward to working more on it.
Elizabeth Wesley: Yes, my god, it’s been my pleasure. I’m so glad that you reached out to me about this. It’s yeah, it’s honestly been a blast and I’m looking forward to continuing this work for sure. So thank you. And thanks for all the hard work. Like you really have he said “we” a lot, but it really has been Nissim doing so much of this,.
Nissim Lebovits: Claude has been carrying both of us. So shout out to Anthropic. But yeah, it’s been it’s been a lot of fun. So thank you so much for joining me. Thanks to Jed for letting me do this and thanks to everybody who’s tuning in.
| Featuring: |

| Tags: | Heat Data · Urban Planning · Climate Data · Land Surface Temperature · Landsat |